Are you trying to figure out which Phoenix neighborhoods still attract strong renters despite all the new apartments coming online? You are not alone. With big deliveries across 2023 to 2025, some parts of the city softened, while others stayed competitive thanks to jobs, amenities, and limited new supply. In this guide, you will learn where demand is holding up, what metrics to watch, and how to screen your next rental deal with confidence. Let’s dive in.
Phoenix rental snapshot
Phoenix saw a construction surge for apartments and build-to-rent communities in 2023 and 2024, with the effects carrying into 2025. Industry reporting shows this wave increased concessions and vacancies in several submarkets, creating a short-term rent correction across the metro. You can see this dynamic summarized in recent Yardi Matrix market writeups and in local coverage of how new supply has pressured advertised rents in parts of the Valley (AZFamily summary).
Against that backdrop, Phoenix still benefits from steady employment drivers in healthcare and life sciences, education, logistics, and advanced manufacturing. The metro’s job base remains a core demand engine, which is why neighborhoods near these hubs often see more consistent leasing traffic. For a quick view of local industry and employment trends, review the BLS Phoenix MSA data.
For context, citywide median gross rent sits roughly in the low-to-mid $1,500s, and the owner-occupied rate is near 57 percent. That split means Phoenix contains both renter-heavy ZIP codes and owner-leaning districts, so micro analysis is key. You can use Census QuickFacts for Phoenix as your baseline when comparing neighborhood-level rents and yield assumptions.
Neighborhoods to watch
Below are Phoenix submarkets where renter demand has been comparatively resilient or where value-oriented strategies have traction. Always validate with current comps, concessions, and the new supply pipeline before you buy.
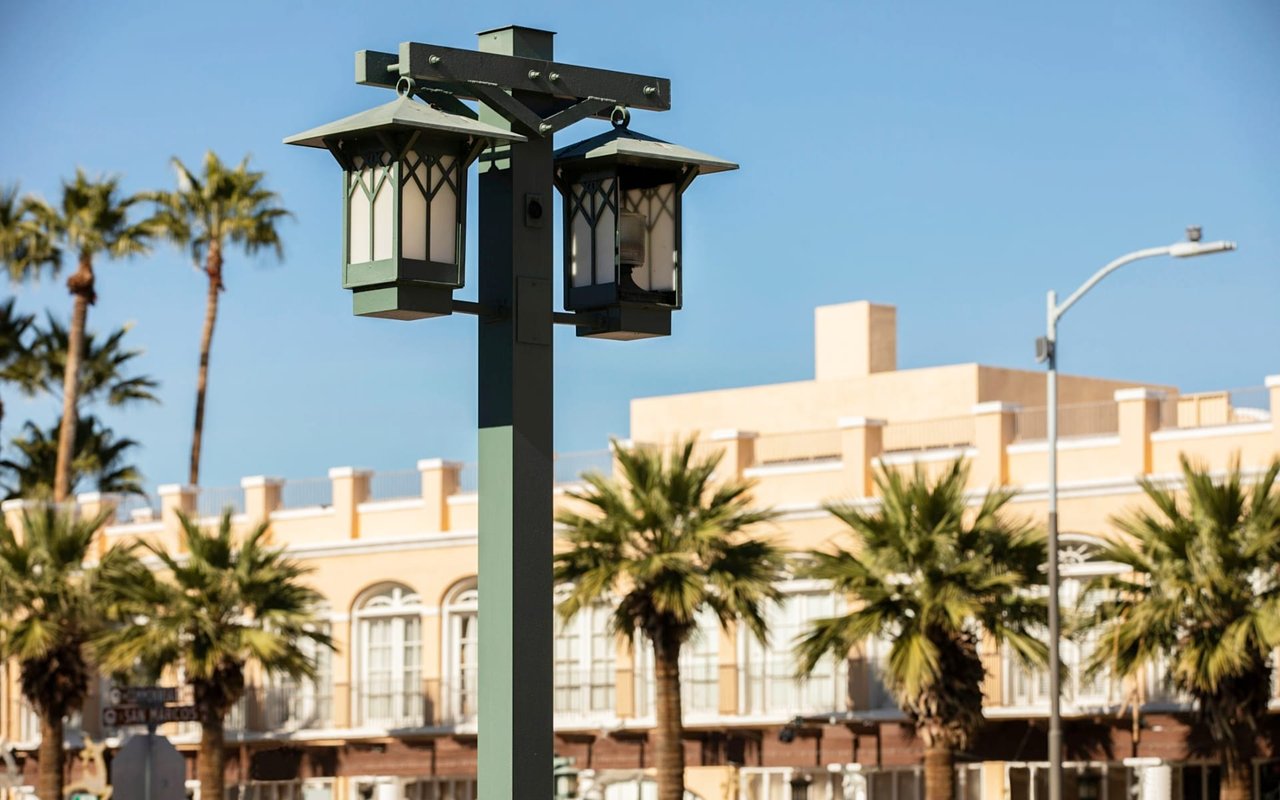
Downtown / Central City
Why it draws renters: Downtown has a concentration of large institutional employers, including the Phoenix Biomedical Campus, regional hospitals, and Arizona State University programs. These anchors create a steady flow of healthcare workers, students, researchers, and professionals. For a snapshot of why life sciences matter locally, see this overview of regional clusters and university-affiliated hubs (business facilities analysis).
What to watch: The building boom delivered numerous luxury mid-rise and high-rise projects in and around Roosevelt Row. That supply can produce near-term softness, with concessions common in lease-up phases. If you plan to buy a condo or small multi in this area, underwrite with conservative rent assumptions, verify effective rents versus advertised specials, and time your vacancies around academic and medical hiring cycles.
Best fits: Smaller multifamily, condos, or townhomes that appeal to professionals seeking proximity to work. Prioritize properties with secure parking, in-unit laundry, and modern systems.
Midtown / North Central
Why it draws renters: Neighborhoods like Willo, Coronado, and Encanto feature historic housing, walkable amenities, and limited space for large new apartment sites. That natural constraint, combined with quick access to downtown jobs, helps support steadier performance for small multifamily and single-family rentals.
What to watch: Renovations should target functional systems first, then tasteful cosmetic updates. Given the age of many homes, line-item your capex for roofs, plumbing, electrical, and HVAC.
Best fits: Duplex to 8-unit buildings and single-family rentals that can be improved for durable cash flow with manageable renovation budgets.
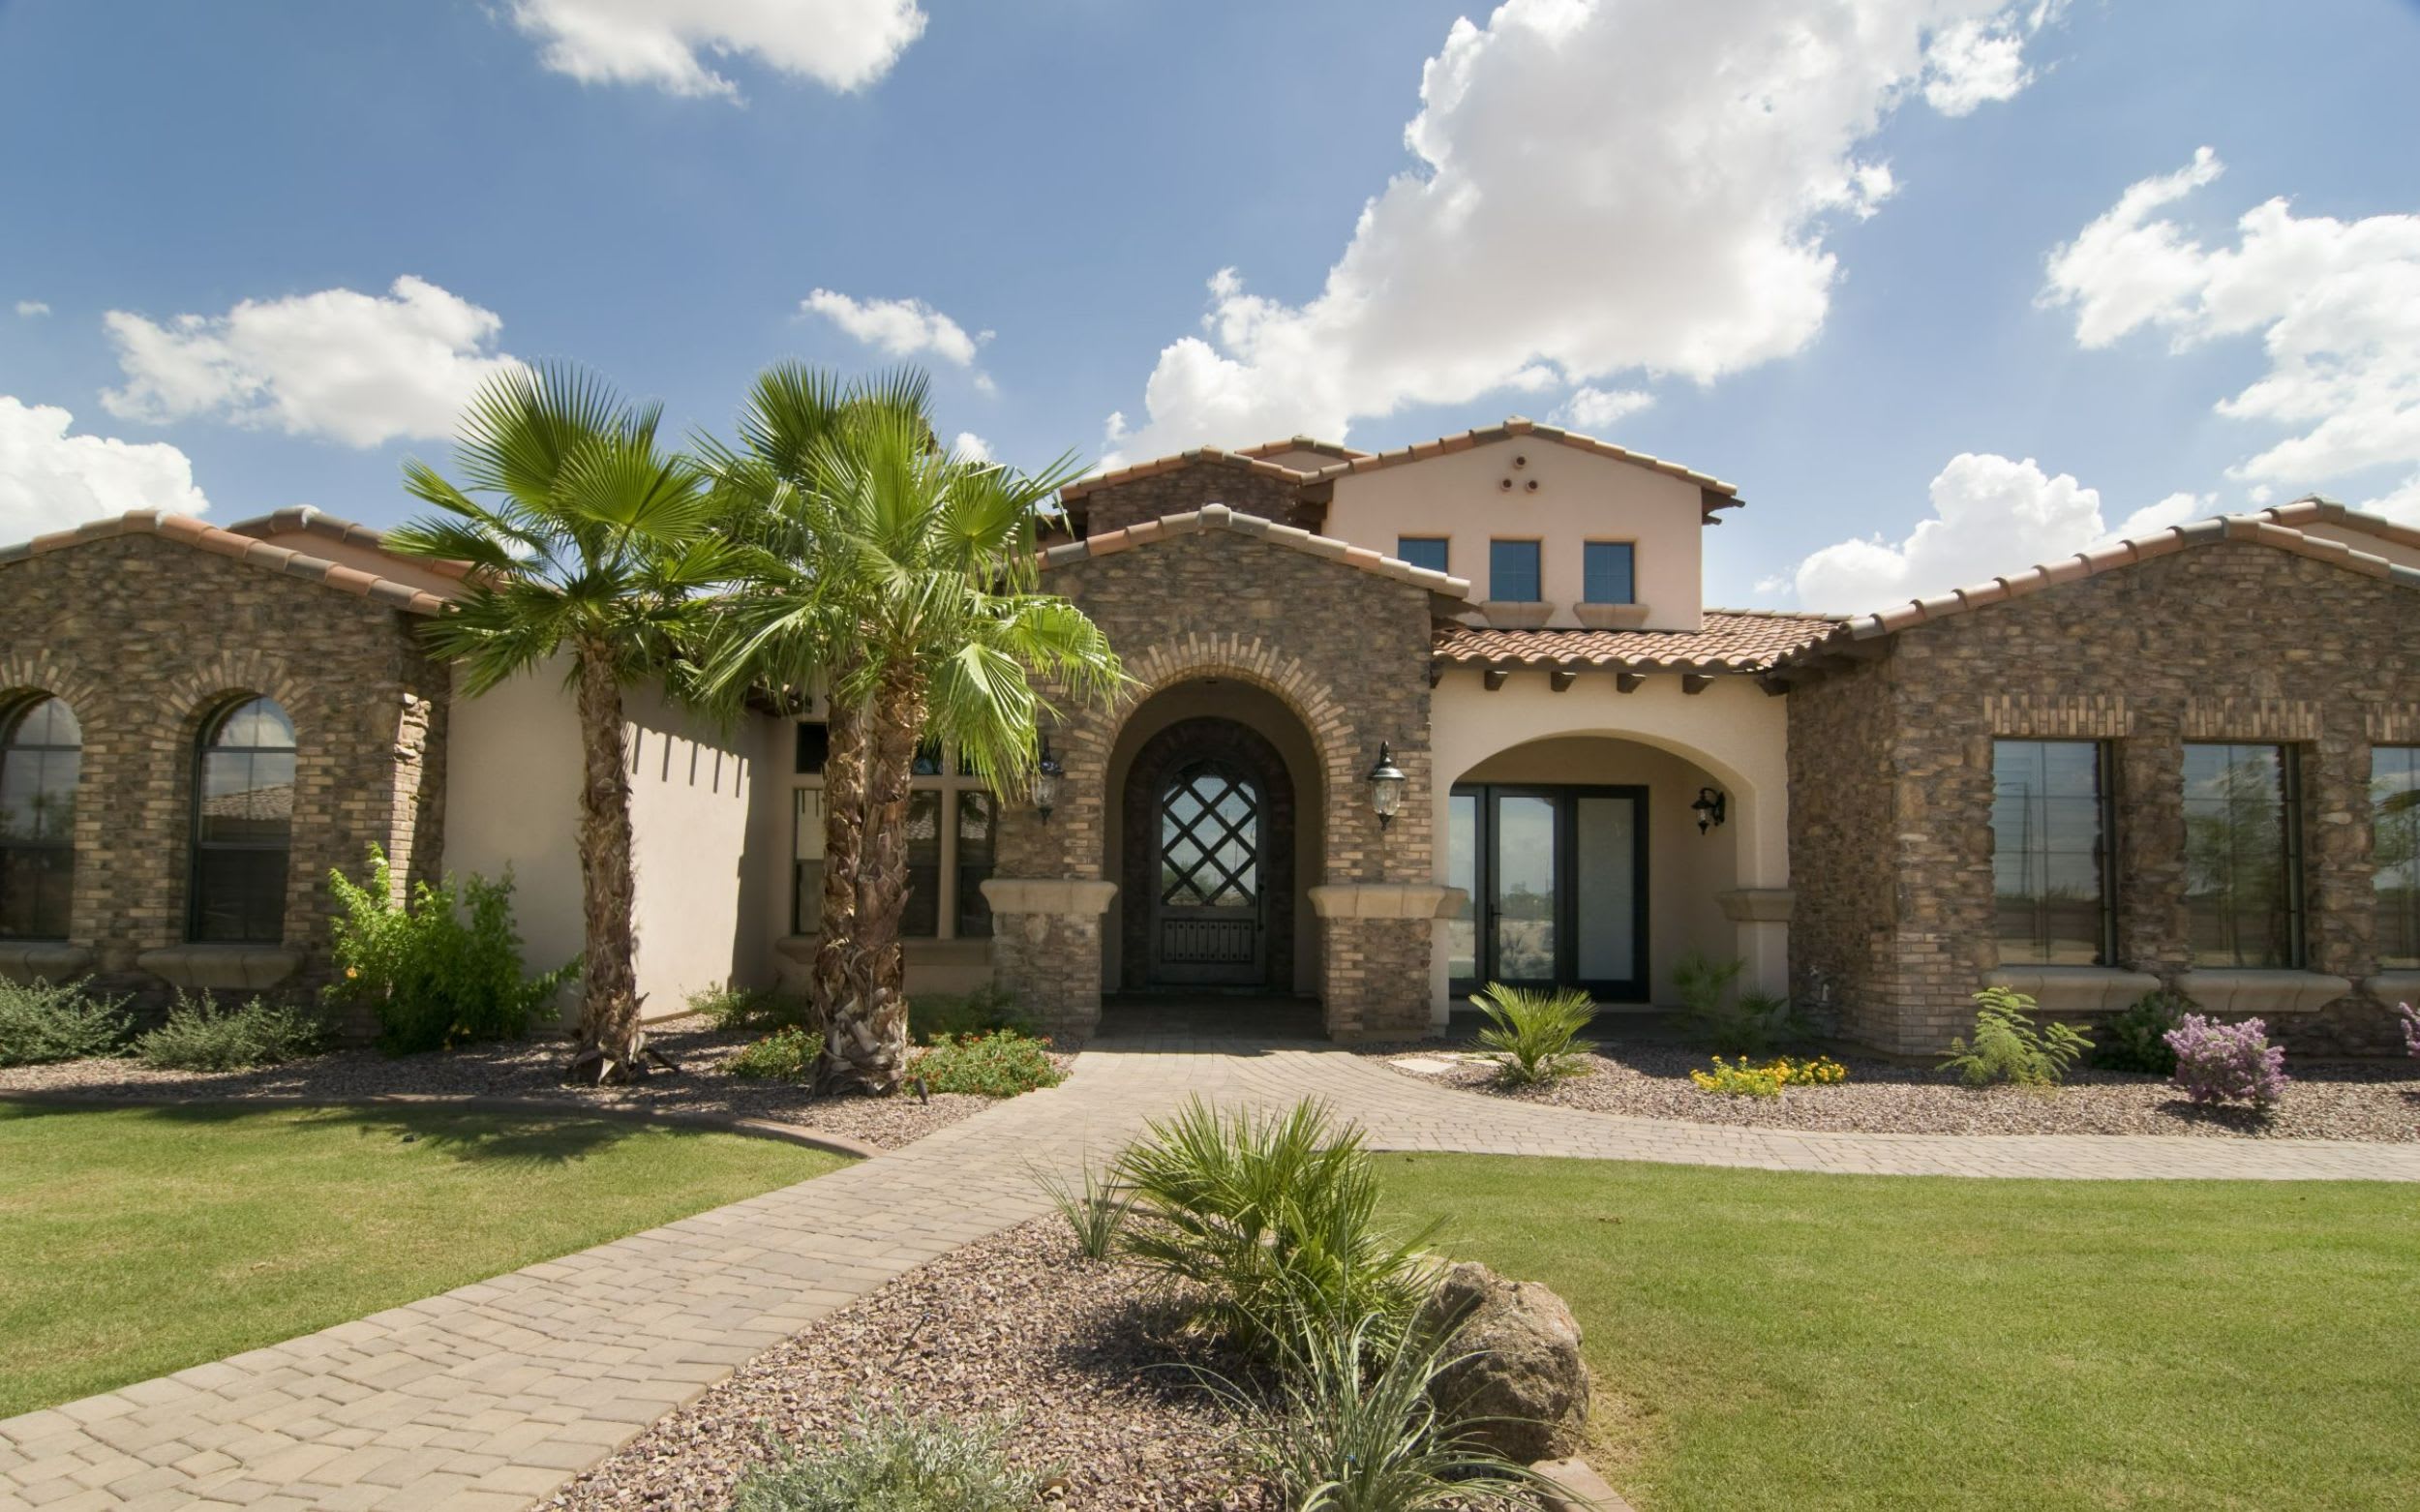
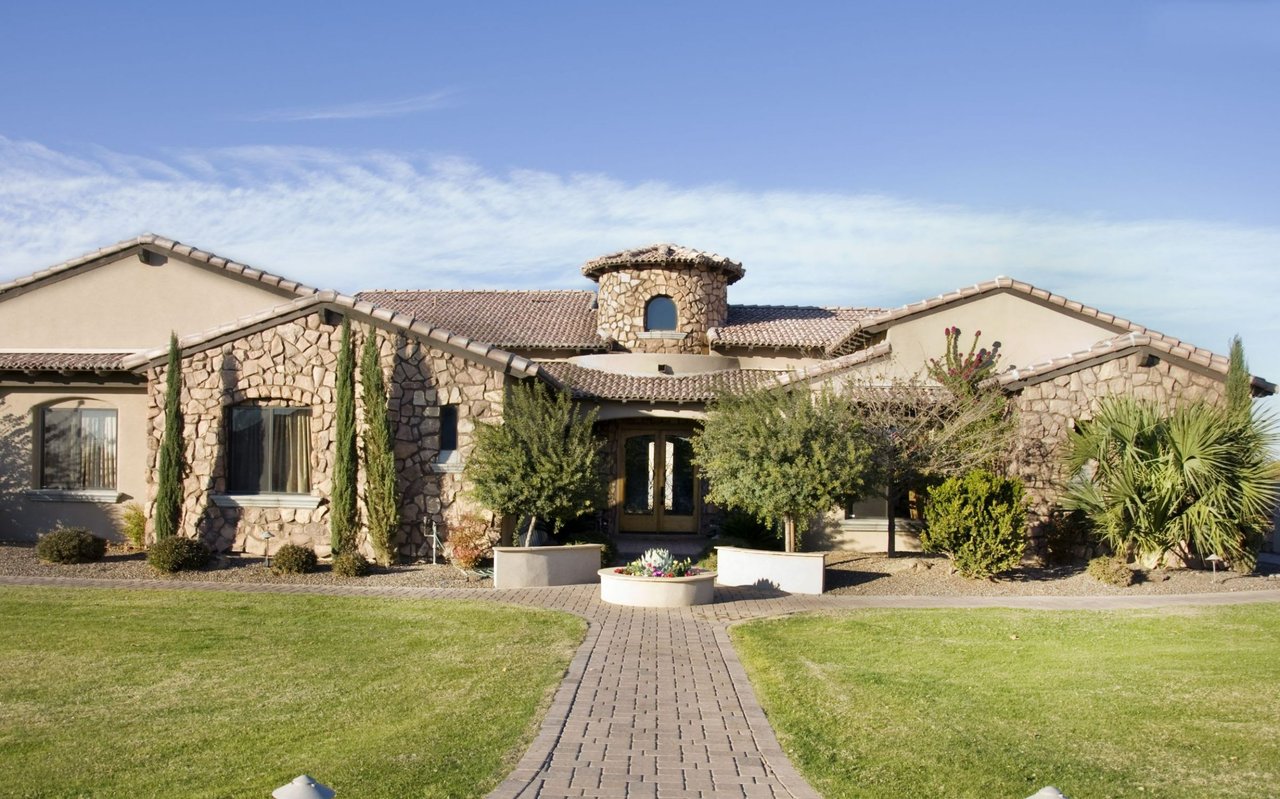
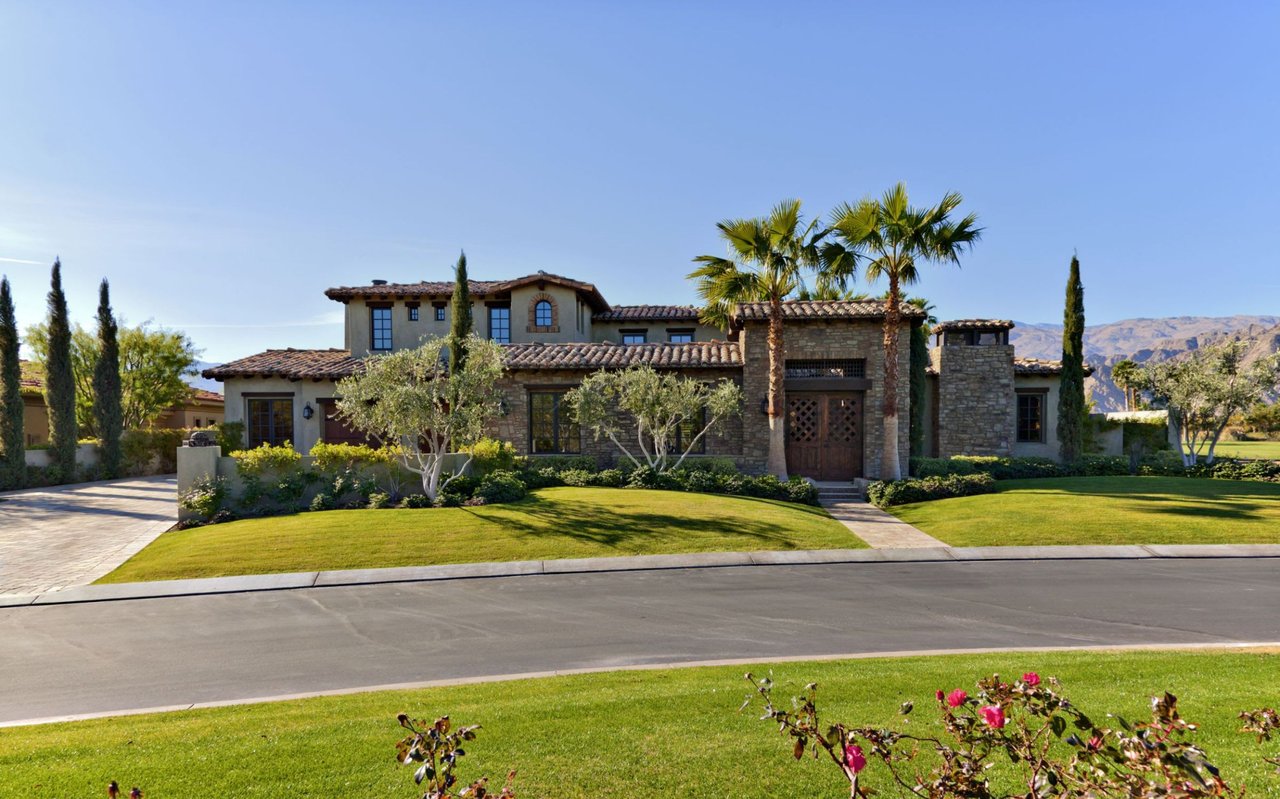
Camelback East / Biltmore / Arcadia
Why it draws renters: This area serves a premium renter base and typically posts rents above the city average for both one-bedrooms and single-family rentals. Supply of large-lot multifamily is limited, which helps support pricing in normal market conditions. You can compare broad neighborhood rent snapshots using tools like RentCafe’s Phoenix rent trends.
What to watch: Acquisition costs are higher, and luxury segments across the metro felt some of the new-supply pressure. If you invest here, target best-in-class finishes, quiet streets, and strong curb appeal that align with premium expectations.
Best fits: Updated single-family rentals, higher-finish condos, and small luxury multis positioned for professional tenants.
North Phoenix / Deer Valley / Desert Ridge
Why it draws renters: These submarkets benefit from nearby employment nodes, airfield and logistics activity, and steady household formation. The product mix includes garden-style apartments and single-family rentals, with some areas showing lower vacancy than core luxury corridors. Hyperlocal rent checks by ZIP can help you fine-tune assumptions using tools like Rentometer’s Phoenix snapshot.
What to watch: Focus on commute times to nearby employers and compare garden-style comps to single-family rentals to understand where your asset will compete most effectively.
Best fits: Single-family rentals and well-located garden-style assets with carport or garage parking.
South Phoenix / Laveen / Maryvale corridors
Why it draws renters: Affordability pressure and steady household growth make value-focused single-family rentals attractive here. Laveen has seen active new for-sale and rental starts, so track the local pipeline before underwriting aggressive rent growth. Phoenix has also been a national leader in build-to-rent completions, which shapes comps for single-family rentals across suburban corridors (industry snapshot).
What to watch: Monitor concessions from nearby new communities and confirm property condition carefully. Efficient management, durable finishes, and realistic rent targets are essential.
Best fits: Value-add single-family rentals and smaller multis where light-to-moderate renovations can raise effective rent without over-capitalizing.
How to spot rising demand
Use objective indicators, then zoom in to the block level. Here are the signals and where to find them:
- Rent level and short-term trends. Compare 3 to 12 months of advertised rents by ZIP or neighborhood. Track advertised versus effective rent when concessions are offered. Public tools like RentCafe can provide quick scans.
- Vacancy, absorption, and concessions. Submarket reports from sources such as Yardi Matrix and local news recaps help you gauge lease-up trends and momentum.
- New supply pipeline. Concentrated deliveries often create short-term headwinds. Track where new units are opening and when they are expected to stabilize using Yardi summaries and city permit dashboards.
- Jobs and employer proximity. Areas close to stable or expanding employers tend to show stronger, more consistent rental demand. Use BLS Phoenix MSA data and regional announcements to map anchors.
- Household formation and tenure mix. Rising household counts and a stable or declining owner-occupancy share can support rental demand. Start with Census QuickFacts and then verify at the ZIP or tract level.
- Product mix and tenant profile. Understand the percentage of single-family versus multifamily units nearby, since these products compete differently. Cross-check with ACS tables or city parcel data.
- Policy shifts. Rules that enable accessory dwelling units or regulate short-term rentals can change supply dynamics. Review Arizona’s 2024 ADU legislation, HB2720, and confirm local interpretations.
First-pass screening checklist
Here is a simple way to narrow your target list before you schedule showings:
Compare recent rent trends and concessions. Eliminate submarkets showing negative momentum over the last two quarters unless you are targeting lease-up arbitrage with a clear plan. Start with Yardi summaries and public rent snapshots.
Map employer anchors. Favor addresses within a short commute to major job clusters such as downtown healthcare and biomedical hubs, Desert Ridge and Deer Valley employment nodes, and the Sky Harbor corridor. Use BLS data and regional announcements to validate.
Check the pipeline. Review building permits and deliveries within a one-mile radius of the target property. High delivery ratios often correlate with deeper concessions in the near term.
Confirm product fit. Decide whether your asset competes with new luxury apartments, garden communities, or single-family rentals. That choice drives finish level, parking needs, and management style.
Underwrite with effective rents. Specials can mask real numbers. Use tools like Rentometer for quick checks, then verify against recent signed leases and active listings.
Stress test your numbers. Use conservative vacancy and capex reserves, especially if nearby deliveries are still stabilizing.
What a local pro should deliver
A strong on-the-ground partner can reduce risk and save you time. Ask for these items before you write an offer:
- Current rent comp memo. Unit-level view by bedroom count and property type, including three recent leases and three active listings. Note concessions and who pays which utilities.
- Lease-up intelligence. A list of recently delivered buildings nearby, current specials, and absorption pace. Include any broker bonuses or short-term incentives.
- Permit and zoning report. Recent permits on the block, active site plans, and approved entitlements within a one-mile radius.
- Tenant profile and turnover. Typical tenant cohorts, average lease terms, and common move-in months.
- Physical and systems checklist. Age and condition of roof, HVAC, plumbing, electrical, appliances, plus a rough capex budget.
- Regulatory review. Feasibility of an ADU under Arizona’s HB2720 and a summary of local short-term rental rules that could affect a mid-term strategy.
The bottom line
Phoenix’s rental market is not moving in one direction. Heavy deliveries created a metro-level correction, yet submarkets with strong job access or tighter supply have shown relative resilience. Downtown and Midtown benefit from institutional anchors, Camelback East and Arcadia cater to premium renters, North Phoenix gains from steady employment nodes, and select corridors in South Phoenix, Laveen, and Maryvale offer value-add potential for single-family rentals.
Your next step is to combine high-level data with block-level intelligence. If you want help building a current rent comp pack, mapping the pipeline, and stress testing your returns, reach out to Celina Acosta for a focused investor consult. Our team works across Phoenix and the Southeast Valley with bilingual service, clear numbers, and a streamlined process from search to lease-up.
FAQs
What Phoenix neighborhoods show resilient rental demand right now?
- Areas near job anchors and limited new supply, including Downtown and Midtown, Camelback East and Arcadia, North Phoenix near Deer Valley and Desert Ridge, and select South Phoenix, Laveen, and Maryvale corridors, based on the submarket signals in industry and public data sources cited above.
How did new apartment supply affect Phoenix rents in 2024–2025?
- A large delivery wave increased concessions and raised vacancies in many submarkets, contributing to a metro-wide rent correction, as summarized by Yardi Matrix and local reporting.
Which data should I check before buying a Phoenix rental?
- Track advertised versus effective rents, submarket vacancy and concessions, nearby deliveries and permits, proximity to major employers, household formation trends, and any policy changes such as ADU rules under HB2720.
Are single-family rentals still competitive in Phoenix?
- Yes, especially in value-focused corridors and areas influenced by the region’s strong build-to-rent presence, which shapes comps and renter expectations (industry snapshot).
What is a good baseline for Phoenix rents when screening deals?
- Use citywide median gross rent, which sits around the low-to-mid $1,500s, as a starting point and then refine by ZIP or tract using neighborhood snapshots and recent signed leases (Census QuickFacts).
How do jobs influence neighborhood rental demand in Phoenix?
- Neighborhoods within a short commute to expanding employment nodes, including downtown healthcare and biomedical hubs and North Phoenix logistics areas, tend to show stronger, more consistent renter interest (BLS Phoenix MSA).